再见云服务器!教你将 Python 脚本快速部署在手机上
1. 前言
大家好,我是安果!
使用 Django 进行 Web 开发时,经常有需要展示图表的需求,以此来丰富网页的数据展示
常见方案包含:Highcharts、Matplotlib、Echarts、Pyecharts,其中后 2 种方案使用频率更高
本篇文章将聊聊 Django 结合 Echarts、Pyecharts 实现图表可视化的具体流程
2. Echarts
Echarts 是百度开源的一个非常优秀的可视化框架,它可以展示非常复杂的图表类型
以展示简单的柱状图为例,讲讲 Django 集成 Echarts 的流程
首先,在某个 App 的 views.py 编写视图函数
当请求方法为 POST 时,定义柱状图中的数据值,然后使用 JsonResponse 返回数据
- from django.http import JsonResponse
- from django.shortcuts import render
-
-
- def index_view(request):
- if request.method == "POST":
-
- # 柱状图的数据
- datas = [5, 20, 36, 10, 10, 20]
-
- # 返回数据
- return JsonResponse({'bar_datas': datas})
- else:
- return render(request, 'index.html', )
在模板文件中,导入 Echarts 的依赖
PS:可以使用本地 JS 文件或 CDN 加速服务
- {#导入js和echarts依赖#}
- <script src="https://cdn.bootcdn.net/ajax/libs/jquery/3.6.0/jquery.js"></script>
- <script src="https://cdn.bootcdn.net/ajax/libs/echarts/5.0.2/echarts.common.js"></script>
然后,重写 window.onload 函数,发送一个 Ajax 请求给后端,利用 Echarts 将返回结果展示到图表中去
- <script>
- // 柱状图
- function show_bar(data) {
-
- //控件
- var bar_widget = echarts.init(document.getElementById('bar_div'));
-
- //设置option
- option = {
- title: {
- text: '简单的柱状图'
- },
- tooltip: {},
- legend: {
- data: ['销量']
- },
- xAxis: {
- type: 'category',
- data: ["衬衫", "羊毛衫", "雪纺衫", "裤子", "高跟鞋", "袜子"]
- },
- yAxis: {
- type: 'value'
- },
- series: [{
- data: data,
- type: 'bar'
- }]
- };
-
- bar_widget.setOption(option)
- }
-
- //显示即加载调用
- window.onload = function () {
- //发送post请求,地址为index(Jquery)
- $.ajax({
- url: "/",
- type: "POST",
- data: {},
- success: function (data) {
- // 柱状图
- show_bar(data['bar_datas']);
-
- //后端返回的结果
- console.log(data)
- }
- })
- }
- </script>
最后,编写路由 URL,运行项目
- from django.contrib import admin
- from django.urls import path, include
-
- urlpatterns = [
- path('',include('index.urls')),
- path('admin/', admin.site.urls),
- ]
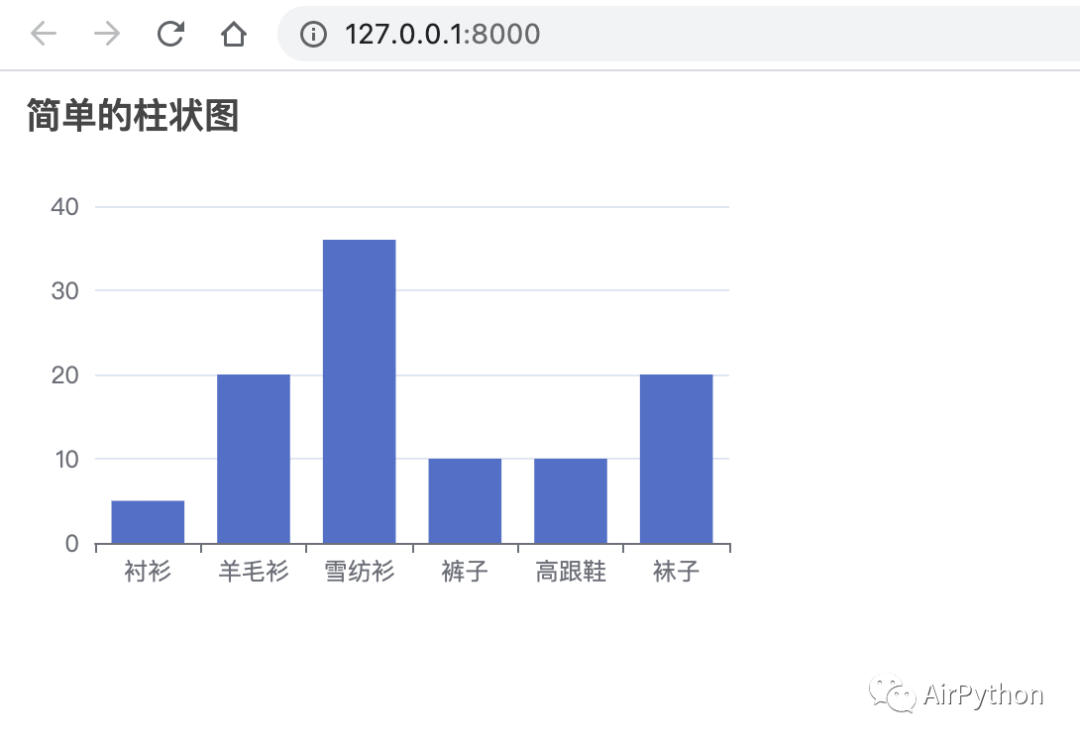
发现,首页展示了一个简单的柱状图

更多复杂的图表展示可以参考官方
https://echarts.apache.org/examples/zh/index.html
3. Pyecharts
Pyecharts 是一款使用 Python 对 Echarts 进行再次封装后的开源框架
相比 Echarts,Django 集成 Pyecharts 更快捷、方便
Django 集成 Pyecharts 只需要 4 步
3-1 安装依赖
- # 安装依赖
- pip(3) install pyecharts
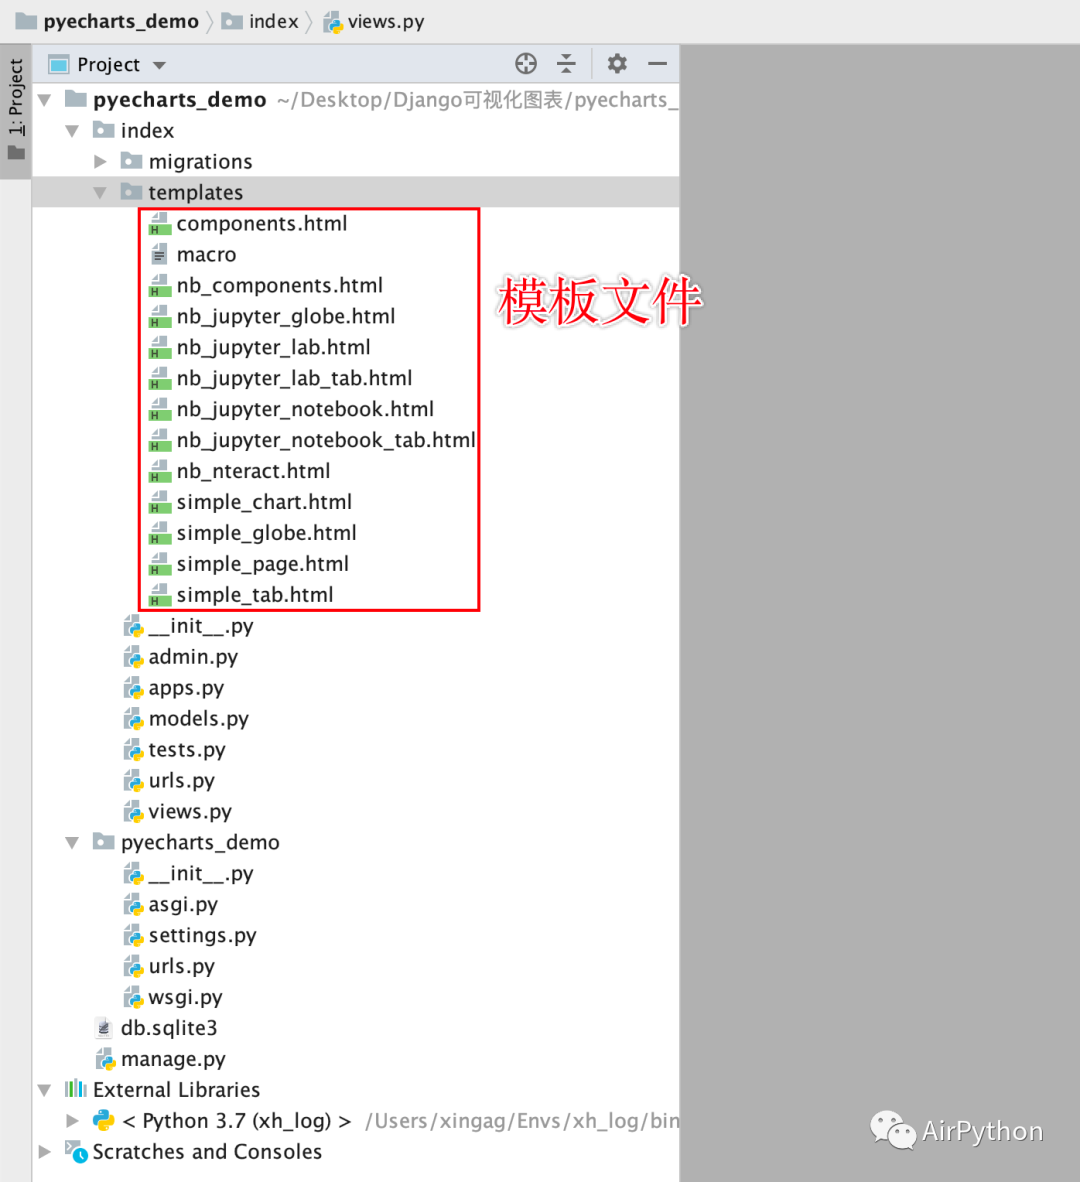
3-2 拷贝 pyecharts 的模板文件到项目下
将虚拟环境中 pyecharts 的模板文件拷贝到项目的模板文件夹下
比如本机路径如下:
/Users/xingag/Envs/xh_log/lib/python3.7/site-packages/pyecharts/render/templates/

3-3 编写视图函数,渲染图表
在视图文件中,使用 pyecharts 库内置的类 Bar 创建一个柱状图
- # Create your views here.
- from django.http import HttpResponse
- from jinja2 import Environment, FileSystemLoader
- from pyecharts.globals import CurrentConfig
-
- CurrentConfig.GLOBAL_ENV = Environment(loader=FileSystemLoader("./index/templates"))
-
- from pyecharts import options as opts
- from pyecharts.charts import Bar
-
-
- # http://127.0.0.1:8000/demo/
- def index(request):
- c = (
- Bar()
- .add_xaxis(["衬衫", "羊毛衫", "雪纺衫", "裤子", "高跟鞋", "袜子"])
- .add_yaxis("商家A", [5, 20, 36, 10, 75, 90])
- .add_yaxis("商家B", [15, 25, 16, 55, 48, 8])
- .set_global_opts(title_opts=opts.TitleOpts(title="Bar-基本示例", subtitle="我是副标题"))
- )
- return HttpResponse(c.render_embed())
3-4 运行项目
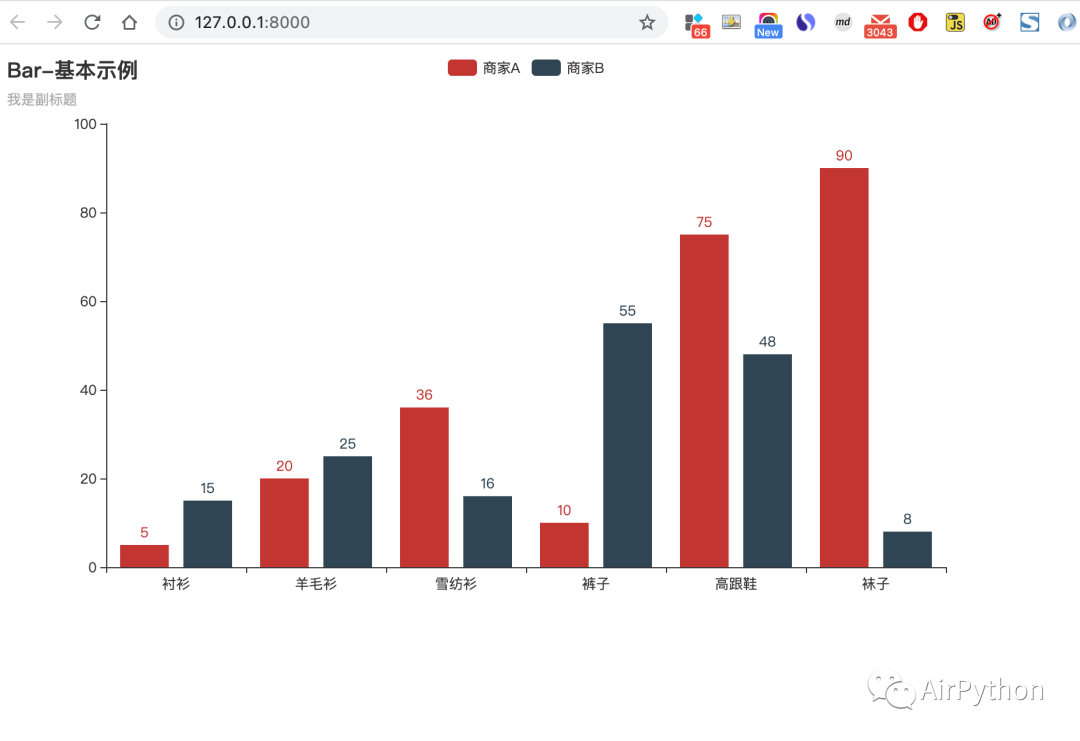
运行项目,生成的柱状图如下:

这只是最简单的使用实例,更多复杂的图表及前后端分离、更新的例子
可以参考官网:
https://pyecharts.org/#/zh-cn/web_django?id=django-%e5%89%8d%e5%90%8e%e7%ab%af%e5%88%86%e7%a6%bb
4. 最后
文中介绍了 Django 快速集成 Echarts 和 Pyecharts 的基本步骤
实际项目中,一些复杂的图表、前后端分离数据更新可以参考官网去拓展
我已经将文中完整代码上传到后台,关注公众号「 AirPython 」后回复关键字「 210406 」获取
作者:星安果
欢迎关注微信公众号 :AirPython


 个人中心
个人中心 退出
退出


 分类导航
分类导航