
 个人中心
个人中心 退出
退出


深入理解 Istio 流量管理的超时时间设置
环境准备
部署 httpbin 服务:
kubectl apply -f samples/httpbin/httpbin.yaml
部署 sleep 服务:
kubectl apply -f samples/sleep/sleep.yaml
httpbin 服务作为接收请求的服务端, sleep 服务作为发送请求的客户端。
设置超时时间
在 sleep 服务中向 httpbin 服务发出请求:
export SLEEP_POD=$(kubectl get pods -l app=sleep -o 'jsonpath={.items[0].metadata.name}')
kubectl exec "$SLEEP_POD" -c sleep -- time curl -o /dev/null -sS -w "%{http_code}\n" http://httpbin.org/delay/5
返回结果如下:
200
real 0m 5.69s
user 0m 0.00s
sys 0m 0.00s
可以看到,请求大约在 5 秒返回 200 (OK)。
创建虚拟服务,访问httpbin 服务时,请求超时设置为 3 秒:
kubectl apply -f - <<EOF
apiVersion: networking.istio.io/v1alpha3
kind: VirtualService
metadata:
name: httpbin
spec:
hosts:
- httpbin
http:
- route:
- destination:
host: httpbin
timeout: 3s
EOF
再次访问,返回结果如下:
504
real 0m 3.01s
user 0m 0.00s
sys 0m 0.00s
可以看到,在 3 秒后出现了 504 (Gateway Timeout)。Istio 在 3 秒后切断了响应时间为 5 秒的httpbin 服务的请求。接下来,我们深入地看一下,Istio是怎么切断请求的?
查看Envoy日志
执行以下命令,查看sleep 服务的Envoy日志:
kubectl logs -l app=sleep -c istio-proxy
可以看到sleep服务对httpbin服务的调用的日志:
{
"authority": "httpbin:8000",
"bytes_received": 0,
"bytes_sent": 24,
"connection_termination_details": null,
"downstream_local_address": "172.24.146.239:8000",
"downstream_remote_address": "172.24.158.25:40384",
"duration": 3001,
"method": "GET",
"path": "/delay/5",
"protocol": "HTTP/1.1",
"request_id": "5ef38816-7f49-48c8-9627-2416e1716293",
"requested_server_name": null,
"response_code": 504,
"response_code_details": "upstream_response_timeout",
"response_flags": "UT",
"route_name": null,
"start_time": "2022-07-01T09:40:13.882Z",
"upstream_cluster": "outbound|8000||httpbin.onemore.svc.cluster.local",
"upstream_host": "172.24.158.96:80",
"upstream_local_address": "172.24.158.25:32846",
"upstream_service_time": null,
"upstream_transport_failure_reason": null,
"user_agent": "curl/7.81.0-DEV",
"x_forwarded_for": null
}
其中,response_flags为UT,表示上游(upstream)请求超时,也就是sleep服务检测到了httpbin服务的请求超时。
执行以下命令,查看httpbin 服务的Envoy日志:
kubectl logs -l app=httpbin -c istio-proxy
可以看到httpbin服务被sleep服务调用的Envoy日志:
{
"authority": "httpbin:8000",
"bytes_received": 0,
"bytes_sent": 0,
"connection_termination_details": null,
"downstream_local_address": "172.24.158.96:80",
"downstream_remote_address": "172.24.158.25:32846",
"duration": 2997,
"method": "GET",
"path": "/delay/5",
"protocol": "HTTP/1.1",
"request_id": "5ef38816-7f49-48c8-9627-2416e1716293",
"requested_server_name": "outbound_.8000_._.httpbin.onemore.svc.cluster.local",
"response_code": 0,
"response_code_details": "downstream_remote_disconnect",
"response_flags": "DC",
"route_name": "default",
"start_time": "2022-07-01T09:40:13.885Z",
"upstream_cluster": "inbound|80||",
"upstream_host": "172.24.158.96:80",
"upstream_local_address": "127.0.0.6:35701",
"upstream_service_time": null,
"upstream_transport_failure_reason": null,
"user_agent": "curl/7.81.0-DEV",
"x_forwarded_for": null
}
其中,response_flags为DC,表示下游(downstream)连接中断,也就是sleep服务的调用请求被中断了。
深入分析
通过Envoy日志,我们可以做出一些分析和判断:
当httpbin服务的请求正常的时候,调用过程如下图: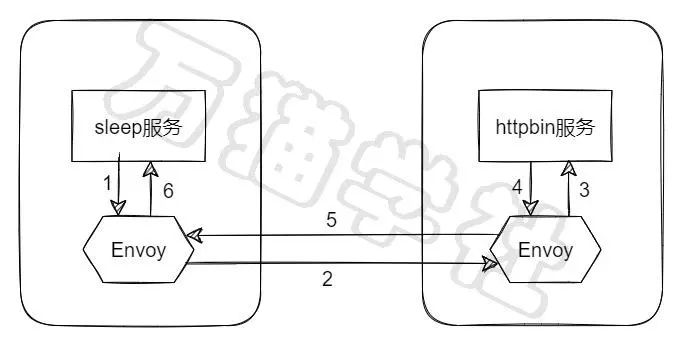
当httpbin服务的请求超时的时候,调用过程如下图:
虽然,我们在httpbin服务上设置的请求超时时间,但实际上主动断开请求的却是sleep服务的Envoy。
清理
kubectl delete virtualservice httpbin
kubectl delete -f samples/httpbin/httpbin.yaml
kubectl delete -f samples/sleep/sleep.yaml
作者:万猫学社
欢迎关注微信公众号 :万猫学社
 分类导航
分类导航